Monday, November 29, 2010

Find all the matches between two vectors using %in% in R

Suppose you want to know all of the matches between one character vector and another, you can do that with the help of which and %in% in R. For example,

> allclasses <- c("physics", "chemistry", "statistics", "mathematics", "biology", "history", "english")
> registered <- c("physics", "mathematics", "history")
> which(allclasses %in% registered)
[1] 1 4 6

This also works with numeric vectors. For example, a numeric set B is a subset of A, and you want to select all those elements that are included in A but not B. You can do the following:

> A <- c(1, 2, 3, 5, 8, 13, 21, 34, 55, 89)
> B <- c(1, 5, 21, 89)
> A[!(A %in% B)]
[1]  2  3  8 13 34 55

Sunday, November 28, 2010

Export to multiple-sheet xls file in R

It's easy to export a data frame or table to .csv file in R. However, sometimes one want to save to a .xls file directly. You can certainly first export to a .csv file and convert it to a .xls file in Microsoft Excel, but the following R codes can do this job directly with ability to save a multiple-sheet .xls file.

> install.packages("RODBC")
> library(RODBC)
> save2excel <- function(x, tname) sqlSave(xlsFile, x, tablename = tname, rownames = FALSE, addPK = T)
> xlsFile <- odbcConnectExcel("C:\\Temp\\test.xls", readOnly = FALSE)
> temp1 <- data.frame(x = rnorm(100), y = rnorm(100))
> temp2 <- data.frame(x = rnorm(100), y = rnorm(100))
> save2excel(temp1, "test1") # Here test is the name of current sheet
> save2excel(temp2, "test2")
> odbcCloseAll()

Saturday, November 27, 2010

Value of last evaluated expression in R

R saves the value of last evaluated expression in a variable called .Last.value. You can directly use this variable instead of running the last expression again.

For example:

> x <- 1:10
> x^2
[1] 1 4 9 16 25 36 49 64 81 100
> y <- .Last.value
> y
[1] 1 4 9 16 25 36 49 64 81 100

Friday, November 26, 2010

Remove inner margins in R plots

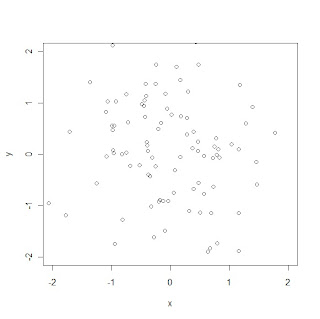
You may notice that xlim and ylim options in R plots do not make the horizontal and vertical axes start and end at your specified values. Instead, by default the specified ranges are enlarged by 6%, so that the specified values do not lie at the very edges of the plot region. This is appropriate for most types of plot, but sometimes we want the specified limits to lie at the edges of the plot window. This can be specified separately for each axis using the arguments xaxs and yaxs. Please refer to the following example and pay attention to the difference of corners in the two plots.

Here is the help document on xaxs and yaxs in R.

xaxs

The style of axis interval calculation to be used for the x-axis. Possible values are "r", "i", "e", "s", "d". The styles are generally controlled by the range of data or xlim, if given. Style "r" (regular) first extends the data range by 4 percent at each end and then finds an axis with pretty labels that fits within the extended range. Style "i" (internal) just finds an axis with pretty labels that fits within the original data range. Style "s" (standard) finds an axis with pretty labels within which the original data range fits. Style "e" (extended) is like style "s", except that it is also ensures that there is room for plotting symbols within the bounding box. Style "d" (direct) specifies that the current axis should be used on subsequent plots. (Only "r" and "i" styles are currently implemented)

> x <- rnorm(100)
> y <- rnorm(x)
> plot(x, y, xlim = c(-2, 2), ylim = c(-2, 2))
> plot(x, y, xlim = c(-2, 2), ylim = c(-2, 2), xaxs = "i", yaxs = "i")